

It’s fourth down with seven minutes left in the fourth quarter. Your favorite team has the ball on their 40-yard line, with 6 yards to go for a first down. They’re down by a touchdown; it’s an obvious punting situation, so you go to grab some more wings anticipating a commercial break. “They’re going for it!?” you hear as you turn around to see the quarterback throw a pass over the head of the star receiver. Rage ensues. Profanities echo throughout the house. Why would you try to convert a fourth down in that situation? Conventional wisdom says to always punt the ball there. The coach needs to be fired… right?
The above scenario is a common occurrence for modern football fans. At times, it can feel like coaches and players make decisions that go against the knowledge that every child athlete learns by age 10. While this can be extremely frustrating (especially if your team loses), these decisions are made because sports analytics tell us they give a winning edge over an alternative option.
Sports analytics utilize data to inform decision making by players, coaches, and team managers to put teams in the best possible position to win games and championships. Data has almost always been collected on teams and players (i.e., individual statistics and box scores), but recent developments in the scale of data collection and statistical techniques use these data to their full potential.
One critical advancement has been the ability to collect data on the physical location of players and the ball on the court or field of play, which teams can use to understand how player arrangement influences success. For example, in the National Basketball Association (NBA), analysts use models to predict the average expected number of points scored on a possession given the arrangement of players on the court. When the expected number of points peaks, that is the best time to shoot. The result? Teams are shooting 20 more three-pointers per game compared to 20 years ago, and they are scoring 21 more points per game over that same time span. Teams win basketball games by scoring more points than the opponent, so all levels quickly adopted this trend.
Having shooters outside of the three-point line optimizes the expected points because 1) three-pointers generate higher points per shot and 2) the defense must guard the three-point line more closely, leading to more open shots at other places on the floor. But that’s not all. Analytics of basketball location data tells us the best shot sometimes comes early in the possession (i.e., transition opportunities). Now, teams shoot earlier in possessions resulting in nearly 10 more possessions per team per game compared to 20 years ago. Taken together, informed changes to the types and timing of shots players take have drastically increased scoring in the NBA, creating more efficient offenses than ever before.

“That’s a terrible shot!” Riley Thoen screams at Joel Embiid through the TV while watching the USA-Serbia Summer Olympic basketball game. Passing the ball to an open Anthony Edwards (All-NBA Minnesota Timberwolf and former UGA Bulldog) would have created a shot with much higher expected points. Such is the life of a sports fan. Photo Credit: Mia Rochford
Football has received drastic changes, too. Like basketball, football analysts can track the location of each player on the field, allowing them to predict the expected number of yards gained on a given play. This allows teams to put the ball in the hands of players in the best positions for them to gain first downs and score touchdowns. While player-position analytics have changed play calling, another aspect of football analytics has taken the recent spotlight: win probability.
Win probability is simply the predicted probability of a team winning the game given the current score, the ball’s position on the field, current down, yards to go, and many other smaller factors. With a prediction of current win probability, teams can forecast how their decisions (e.g., going for it on fourth down) change their win probability. Indeed, one finding of analytics is that National Football League (NFL) teams historically have been too conservative on fourth downs, as going for it can provide a boost to win probability compared to punting. Based on the scenario outlined in the opening, going for it on fourth down gives a 15% win probability instead of 12% for a punt (Figure 1). Although the margins are slim, going for it provides a slight predicted edge, and football is a game of inches, so teams will always look for small advantages.
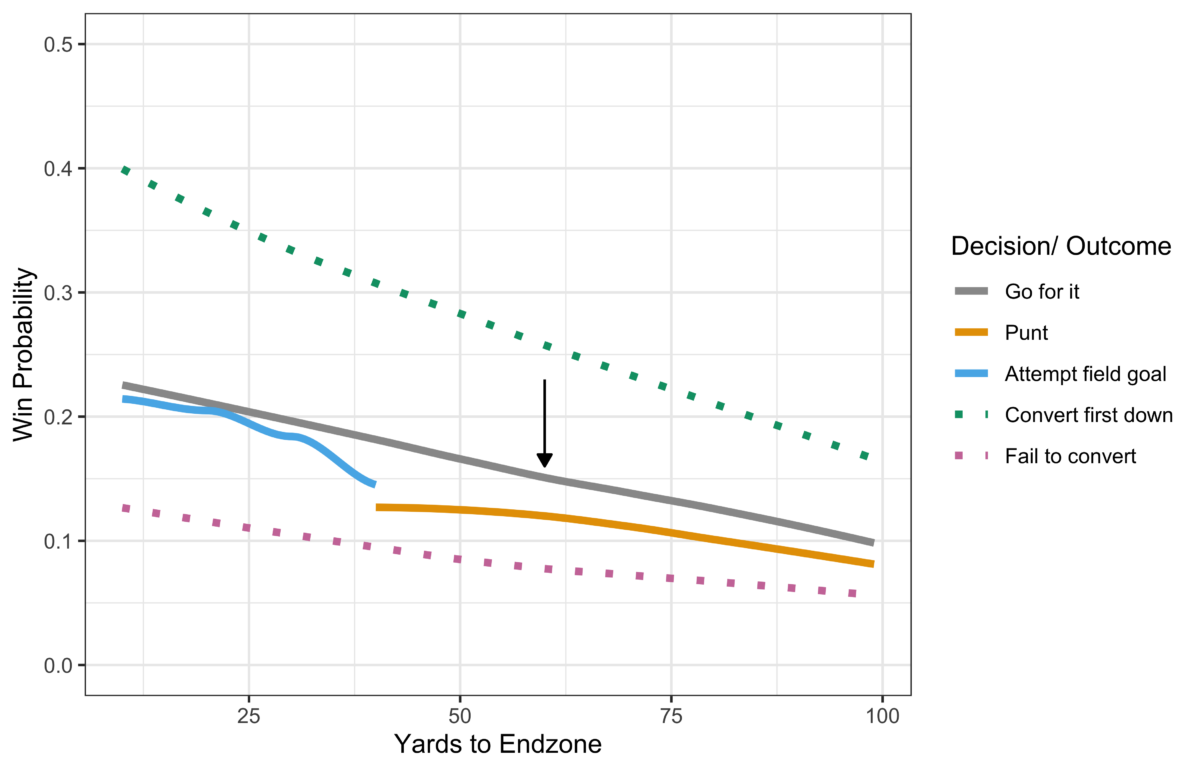
Figure 1. Expected average win probability for all NFL teams in 2023 if they are down by 7 points, with 7 minutes to play, and 6 yards to go on 4th down across all yard lines. The black arrow points to the scenario outlined in the opening of this article. Solid lines display win probabilities given the decision to kick or go for first down, while dotted lines display win probability whether a first down was converted in the situation. Notice that average win probabilities are higher when going for it than kicking, but that the outcome of going for it causes large swings in win probability. This figure was made in R version 4.0.2, with ggplot2, using data from nflfastR and nfl4th. Note that this figure just displays average win probabilities; the probabilities vary among teams, opponents, stadiums, etc…
Even though analytics provide an objective prediction of how certain decisions favor your team, they prove to be quite controversial in sports media. I think this is for two reasons. First, it’s hard to separate the decision-making process from the outcome. For example, although going for a fourth down may provide a 3% boost to win probability, if the team fails on fourth down, it is devastating (and the win probability immediately plummets – see Figure 1). It is easy to bash that decision in hindsight, however, it’s important to remember that choosing to go for it on fourth down is a decision that provides a higher win probability than the punt. Next, in many instances, sports analytics goes against the conventional wisdom of a sport. After all, win probability analytics tell us that teams have historically been too conservative, so a paradigm shift to an aggressive, win-optimizing strategy is jarring.
Sports analytics have changed the game. From NBA scores skyrocketing to NFL teams becoming more aggressive, these changes are here to stay. So, next time you are watching a sports game and are baffled by decision making, I implore you to consider why that decision was made at the time the decision was made. And please, try to separate the process of the decision from the outcome. In most cases, I bet analytics say it’s the right call.
About the Author

Riley is a PhD student in the Department of Plant Biology. He received his B.A. in honors biology from Gustavus Adolphus College in Saint Peter, MN. Riley's research aims to understand how habitat fragmentation and climate change influence plant conservation through effects on the ecology and evolution of populations. Currently, his research highlights how climate change is affecting stress-adapted plant populations on Georgia's granitic outcrops. If he's not in the field doing his research, you'll find Riley watching marble races.